The Background
It is beyond any doubts that Google maps have disrupted the way we use maps in mobile. It has revolutionised the way we travel, use location-based content, show live traffic data or use it just for fun. In fact, Google Maps has tremendously increased tourism with more and more travellers preferring to use roads than other means.
Over the years, Google Maps has improved greatly. The advancements in hardware and software have enabled Google to pack in very powerful features. One such feature is the AI-based alternate routes recommendation.
Google Maps, by default, calculates the distance between two points and plots the shortest route possible over the map surface. This is the primary recommended route and highlighted in blue. The secondary alternate routes are displayed in grey. This feature is very helpful in letting the user decide the optimal route based on live traffic data or personal preferences. However, in Indian context, this information is not enough in letting the user decide the best route. There’s a piece of even more important information missing, and it is the condition of the road surface.
The Objective
The objective of this research is to use smartphones as a means to measure and visualise the road surface condition in the map UI by analysing the vibrations observed by the accelerometer.
Tools & Technologies
Google Maps is used as the map service for illustrating the road surface quality and traffic data.
To measure the vibration, an Android app iNVH developed by Bosch is used. This app has the feature to record vibrations in x, y and z dimensions and generates a CSV file that can be exported. And, to represent it graphically, DatPlot desktop tool built by Michael Vogt is used. It accepts the CSV data and plots individual charts for all the 3 axes.
Finding a Solution
The problem can be solved the same way Google Map works out real-time traffic data.
Google analyses road traffic to give us a pretty accurate indicator of the length of a roadblock and the approximate time to clear it. It uses multiple factors like:
- Road sensors used by local highway authorities
- Data from taxi fleets
- Telecom service providers, and
- Anonymous GPS data from smartphones
How Google computes traffic data using smartphones
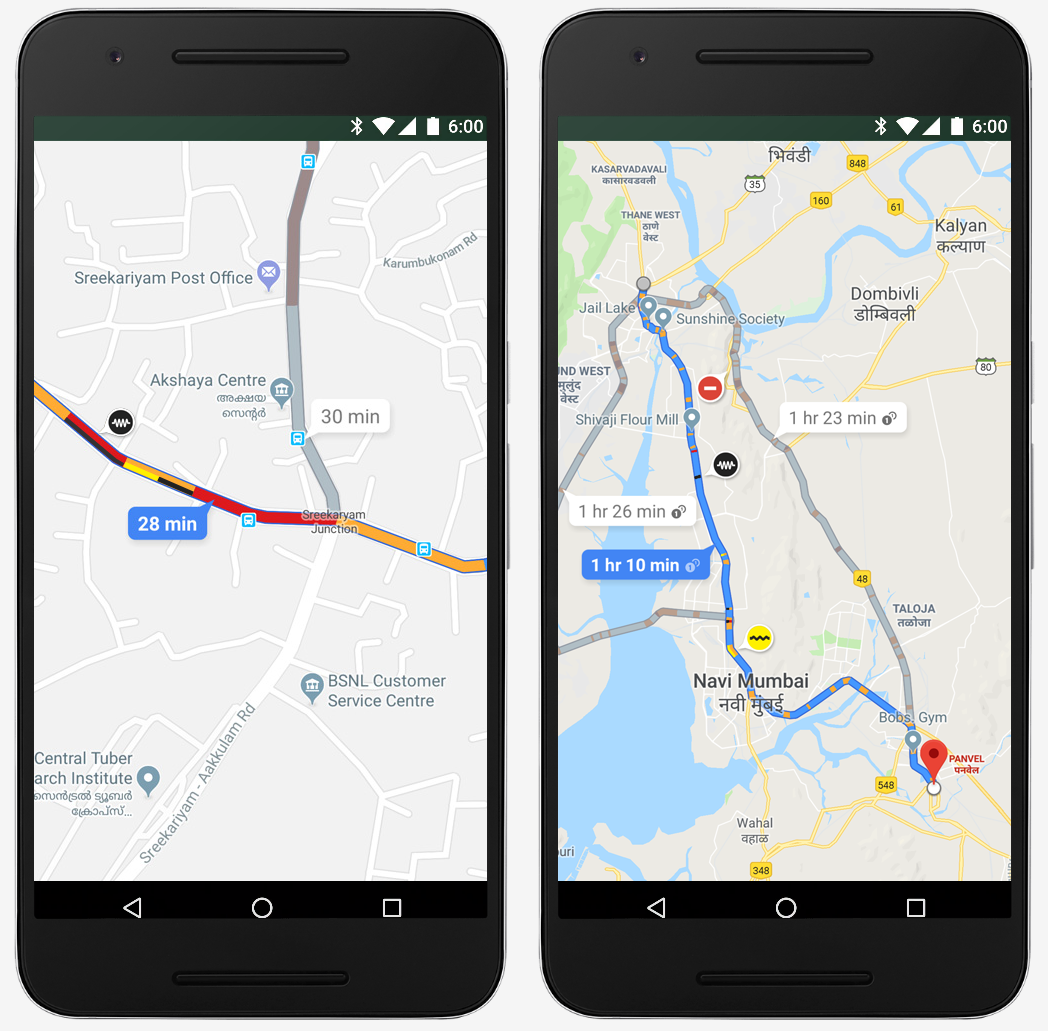
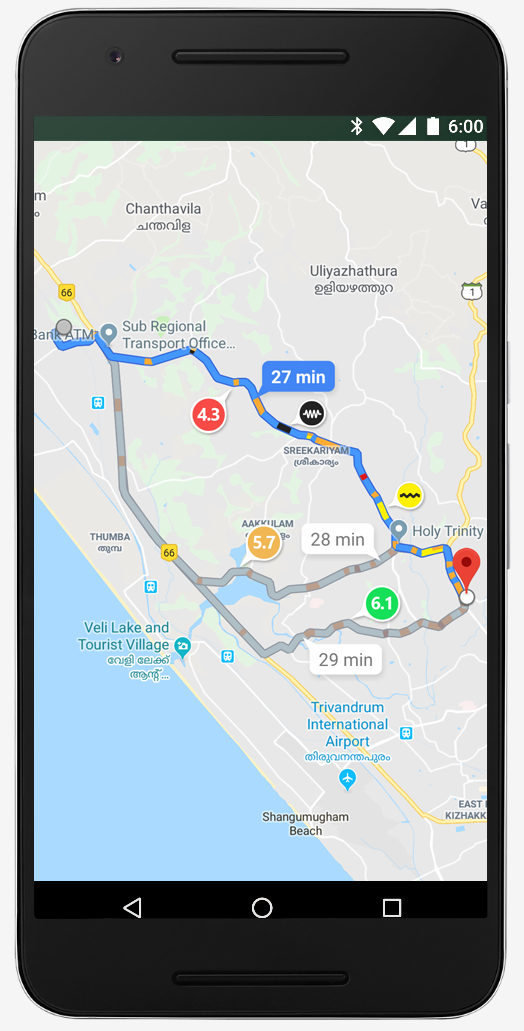
The GPS device inside any smartphone, tracks and transmits the location (longitude and latitude) and speed at which the vehicle is moving. Based on the location accuracy, the live position of the vehicle is plotted on the map. Whenever there’s any interruption in the speed of the vehicle, it is marked and sent to Google. As and when more data gets accumulated through crowd-sourcing, Google Maps is able to plot the traffic condition to a pretty accurate rate. Based on the traffic density and average time taken to move across the jam, the navigation segments are coloured amber or red.
The below graphic shows the traffic conditions of a cross-road at different times of the day. It is interesting to note that based on traffic density, the time to cover that route changes dynamically.

How to use smartphones to measure road conditions?
A simple logic can be applied to measure the road surface conditions. The smoother the road surface, lesser the vibration will be observed and rougher the road, more the vibration will be observed in the vehicle and in-turn the accelerometer in the smartphone.
Let’s investigate, if by using the smartphone accelerometer along with the technology used for live traffic data, can we get any insights on road condition?
But first, let’s understand what an accelerometer is and how it works.
What is a smartphone accelerator?
The electro-mechanical system also called MEMS (micro-electro-mechanical systems) is made up of Silicon and can move between the sensors inside the housing. Any movement in the smartphone, triggers the Silicon structure to vibrate and generate a capacitance change relative to the frequency and amplitude of movement.
Three of these systems across each x, y and z planes can accurately track the orientation and movement of smartphone and trigger any event inside the phone.
Let's get to work
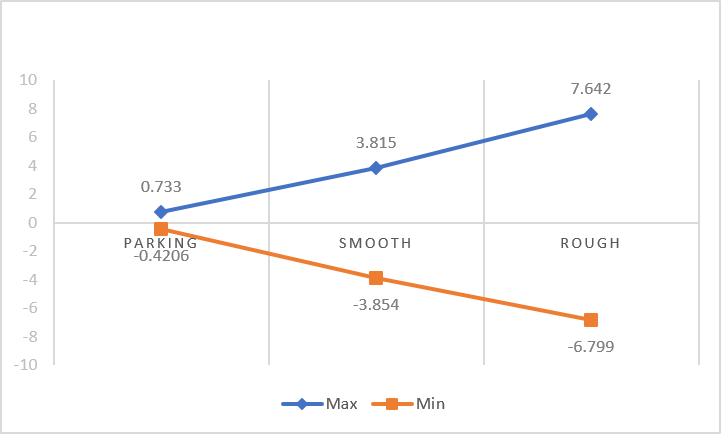
The x-axis represents the time in seconds and the y-axis in each of the 3 graphs, represents the acceleration measured in m/s2. This represents the rate at which accelerometer changes its velocity per unit of time.
The vibration data reveals that there’s very minimal vibration observed in the horizontal planar axis of x and y. The vertical dimension or the z-axis detects maximum vibration.
The maximum and minimum value recorded is +0.733 and -0.4206.
Vibrations from a smoother tarmac
A video of the vehicle moving in a smooth stretch of road. The speed of the vehicle was around 70 kms/hr.
Let’s observe the vibrations experienced by the iNVH app.
Vibrations from a rough patch
Examining the vibration data
It is noticeable from the recorded data that there’s considerable variation in the amplitude of vibration observed by the iNVH app when tested on the smoother road surface and a rough patch.
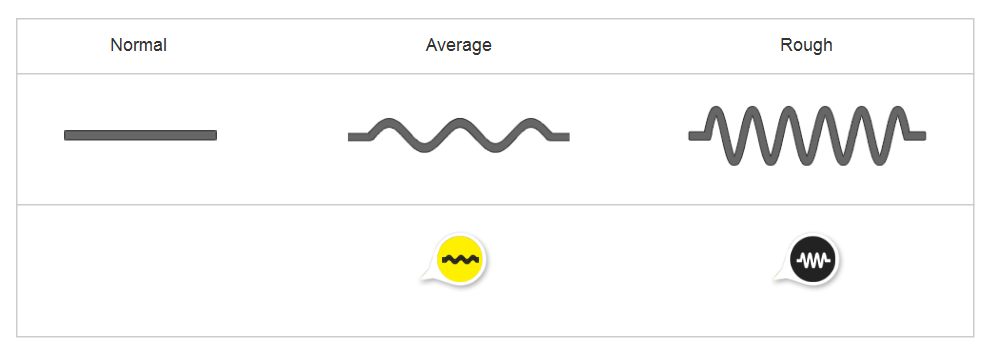
Based on the amplitude displacement, certain threshold value can be set that can categorise any road surface as normal, average or rough.
Visualising the vibration data
It was a challenge to visualise the road condition types in the map UI. There will be instances of rough roads coupled with heavy traffic. Or, average roads coupled with medium traffic, or the mix of both. This problem was solved by:
- Providing a toggle action in the map to switch between traffic data and road condition, or
- Visualise an innovative way to include both the traffic data and road condition together
Since both the data elements are supplementing each other, it has to be available together on the map.
Multiple design variations of option 2 were tried and tested with 5 users.
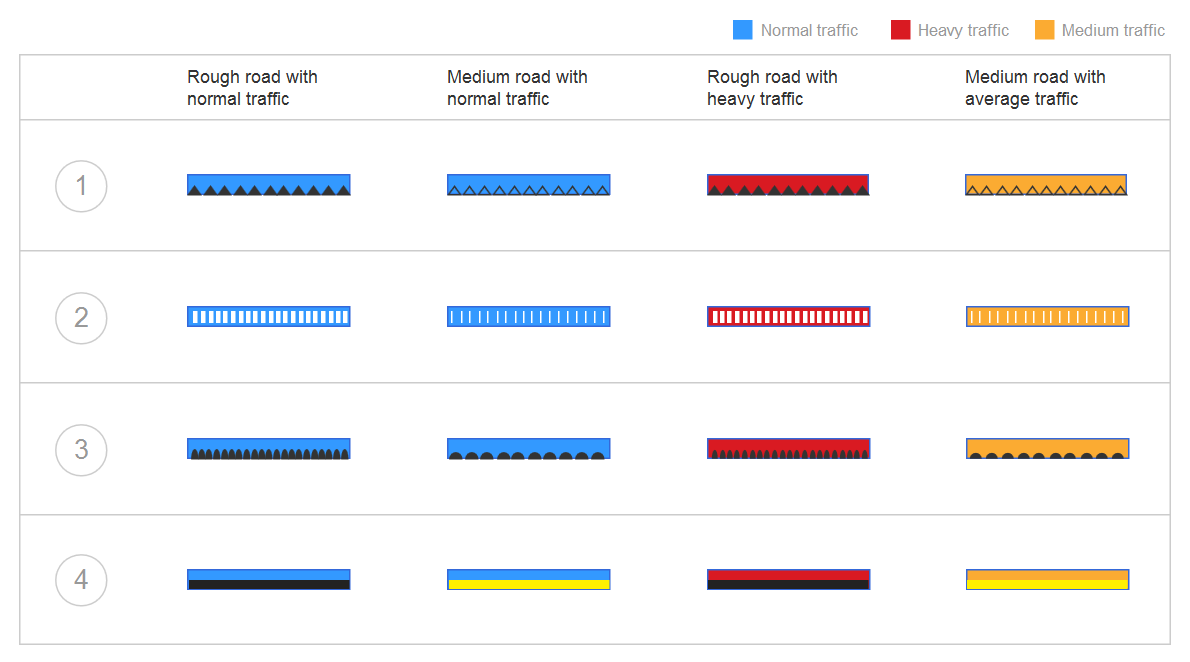
Users preferred Option 4 over others because of its minimalist approach. However, since it uses only colour to differentiate the road types, additional visual cues had to be added for better comprehension by the users.
The existing Google Maps colour palette for navigation was extended to include the road condition types.
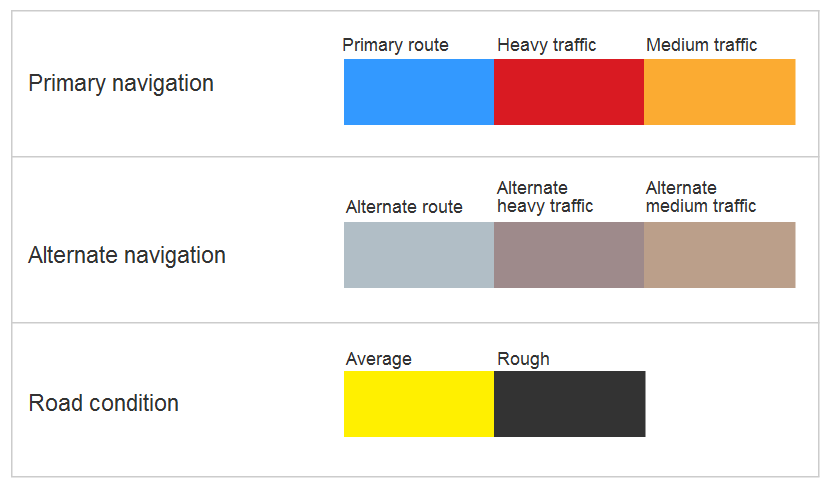
The UI is now showing traffic data along with the road condition type. Yellow colour denotes average road surface whereas dark grey represents the rough road.
Powered with this new set of insights, Google Map UI looks and behaves way more intuitive than before. In one view, users can get live traffic data along with the road condition which is going to make it easier for users to select the best route.
However, there’s still one more limitation. It is up to the user again to make sense of all the available information and make the right informed decision.
Final hypothesis
Let’s hypothesise the possibility of using technology to make that decision for us.
The available data parameters can be combined together using an algorithm to generate a numeric value termed, Road Health Index, that will indicate the health or drivability factor of any road.
The following data parameters can be used for this:
- Route distance,
- Drive time,
- Traffic density,
- Road surface condition, and
- Road width (research conducted to measure road width by data from hi-res satellite images and aerial photos)
Road Health Index can be represented on a scale of 1–10 with 10 being the best route with the essence of all the above parameters.
With the Road Health Index value, it would be so much easier to select the optimal route from all the recommended ones. The alternate routes recommendation feature would be an even more powerful and will take map navigation to a totally new level.
Conclusion
Bad roads in India are not going to go away any time soon. So, the mapping services need to consider this fact and provide unique and innovative solutions to Indian consumers. This is an attempt in that direction to augment the Google Maps UI to understand the Indian psyche of how we use our roads and provide a tailor-made “desi” solution, just for us.
References
- https://en.wikipedia.org/wiki/Google_Traffic
- http://labinyourpocket.com/sensors-the-accelerometer/
- http://www.techulator.com/resources/8930-How-does-smart-phone-accelerometer-work.aspx